

After reaching an all-time around $540 in mid-February, the Nasdaq 100 ETF (QQQ) dropped almost 14% to make a new swing low around $467. With the S&P 500 and Nasdaq bouncing nicely this week, investors are struggling to differentiate between a bearish dead-cat bounce and a bullish full recovery.
There was no question that valuations had become incredibly rich going into the end of 2024, so some sort of corrective move was widely anticipated in Q1 2025. But was the February to March drawdown enough to appease the valuation trolls and empower investors to buy weakness to drive prices to further all-time highs? Today, we’ll lay out four potential outcomes for the Nasdaq 100 ETF (QQQ).
As I share each of these four future paths, I’ll describe the market conditions that would likely be involved, and I’ll also share my estimated probability for each scenario. The goal of this example of “probabilistic analysis” is to expand our thinking of what’s possible, to break down our preconceived market biases, and to open our minds to alternative points of view.
Before we do so, though, I’d love to revisit the last time we conducted this exercise on the Nasdaq 100 back in December 2024.
Going into early January, it appeared that Scenario 4, the Super Bearish scenario, was matching very closely with market action. But a very choppy month of January kept prices fairly stable, and by the end of January the Nasdaq 100 was very close to the end of our Scenario 3.
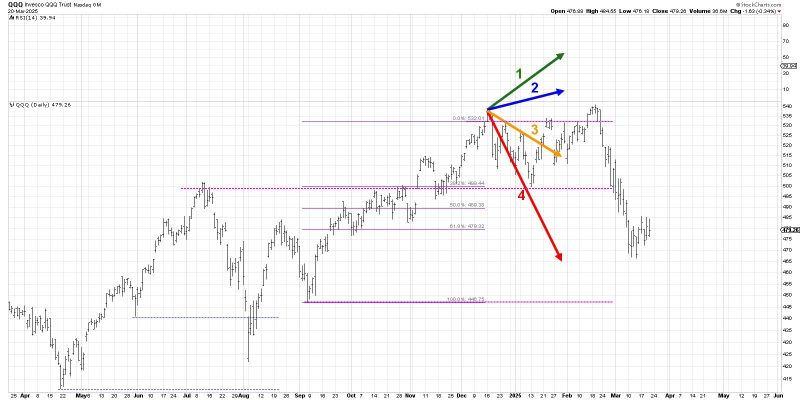
Back to the current market environment, we’re thinking a Very Bullish Scenario would mean the QQQ continues the current uptrend, which eventually becomes a full recovery to retest the February 2025 high. On the other hand, if this week is really more of a dead cat bounce, then the Super Bearish Scenario could take us all the way down to retest the August 2024 lows.
And remember, the point of this exercise is threefold:
- Consider all four potential future paths for the index, think about what would cause each scenario to unfold in terms of the macro drivers, and review what signals/patterns/indicators would confirm the scenario.
- Decide which scenario you feel is most likely, and why you think that’s the case. Don’t forget to drop me a comment and let me know your vote!
- Think about how each of the four scenarios would impact your current portfolio. How would you manage risk in each case? How and when would you take action to adapt to this new reality?
Let’s start with the most optimistic scenario, involving the QQQ continuing this week’s rally to retest the recent all-time high.
Scenario 1: The Very Bullish Scenario
I’ve heard plenty of calls that last week’s low was actually “the” low and the bottom is now in. But for the Nasdaq 100 to get all the way back up to $540, we would need to see a dramatic recovery in the Mag 7 names. Without a rally from the mega-cap growth trade, I don’t think it’s even possible for this sort of bull phase to play out. Given the continued weakness in charts like META, I’d say this is a low probability.
Dave’s Vote: 5%
Scenario 2: The Mildly Bullish Scenario
What if we do see a recovery in most sectors and themes outside the Mag 7 stocks? Scenario 2 would mean the QQQ can only get up to around $200, because without the biggest growth names participating the uptrend has limited momentum. Breadth conditions would definitely improve in this scenario, as stocks thrive on a decent Q1 earnings season.
Dave’s vote: 20%
Scenario 3: The Mildly Bearish Scenario
The two bearish scenarios would mean that the recent upswing starts to turn lower as renewed fears of inflation, geopolitical risk, and a weak earnings season all weigh on risk assets. A mildly bearish scenario means perhaps that we see some signs of optimism as investors begin to feel more familiar with the flurry of policy decisions from Washington. And even though we haven’t gained much ground by the end of April, it definitely feels as if the bear phase is limited.
Dave’s vote: 30%
Scenario 4: The Super Bearish Scenario
What if the flurry of policy decisions we’ve seen is just an appetizer, and the main course arrives in April? Given the global instability and economic concerns, it’s not hard to envision a scenario where the February to March drop was the first in a multi-wave decline that takes the QQQ back down to the August 2024 lows. This scenario seems like the most likely outcome based on the breadth and momentum deteriorations we’ve been tracking for months on our daily market recap show.
Dave’s vote: 45%
What probabilities would you assign to each of these four scenarios? Check out the video below, and then drop a comment with which scenario you select and why!
RR#6,
Dave
P.S. Ready to upgrade your investment process? Check out my free behavioral investing course!
David Keller, CMT
President and Chief Strategist
Sierra Alpha Research LLC
Disclaimer: This blog is for educational purposes only and should not be construed as financial advice. The ideas and strategies should never be used without first assessing your own personal and financial situation, or without consulting a financial professional.
The author does not have a position in mentioned securities at the time of publication. Any opinions expressed herein are solely those of the author and do not in any way represent the views or opinions of any other person or entity.